How many access points do I need? How to estimate the right number of devices for professional networks
How many access points do I need? A common question in professional network deployment. Estimating the number of access points for different environments is crucial: especially in structures with large areas and requiring large numbers of devices, calculating the wrong number can lead to unexpectedly high costs and a feeling of dissatisfaction when buying unnecessary APs. Conversely, when you want to save too much money, you risk underestimating the number of devices and not buying enough access points for your business.
Tanaza has defined the most important factors to consider and how to estimate the number of access points required.
What factors to consider when estimating the number of access points?
Check floor plan of the environment
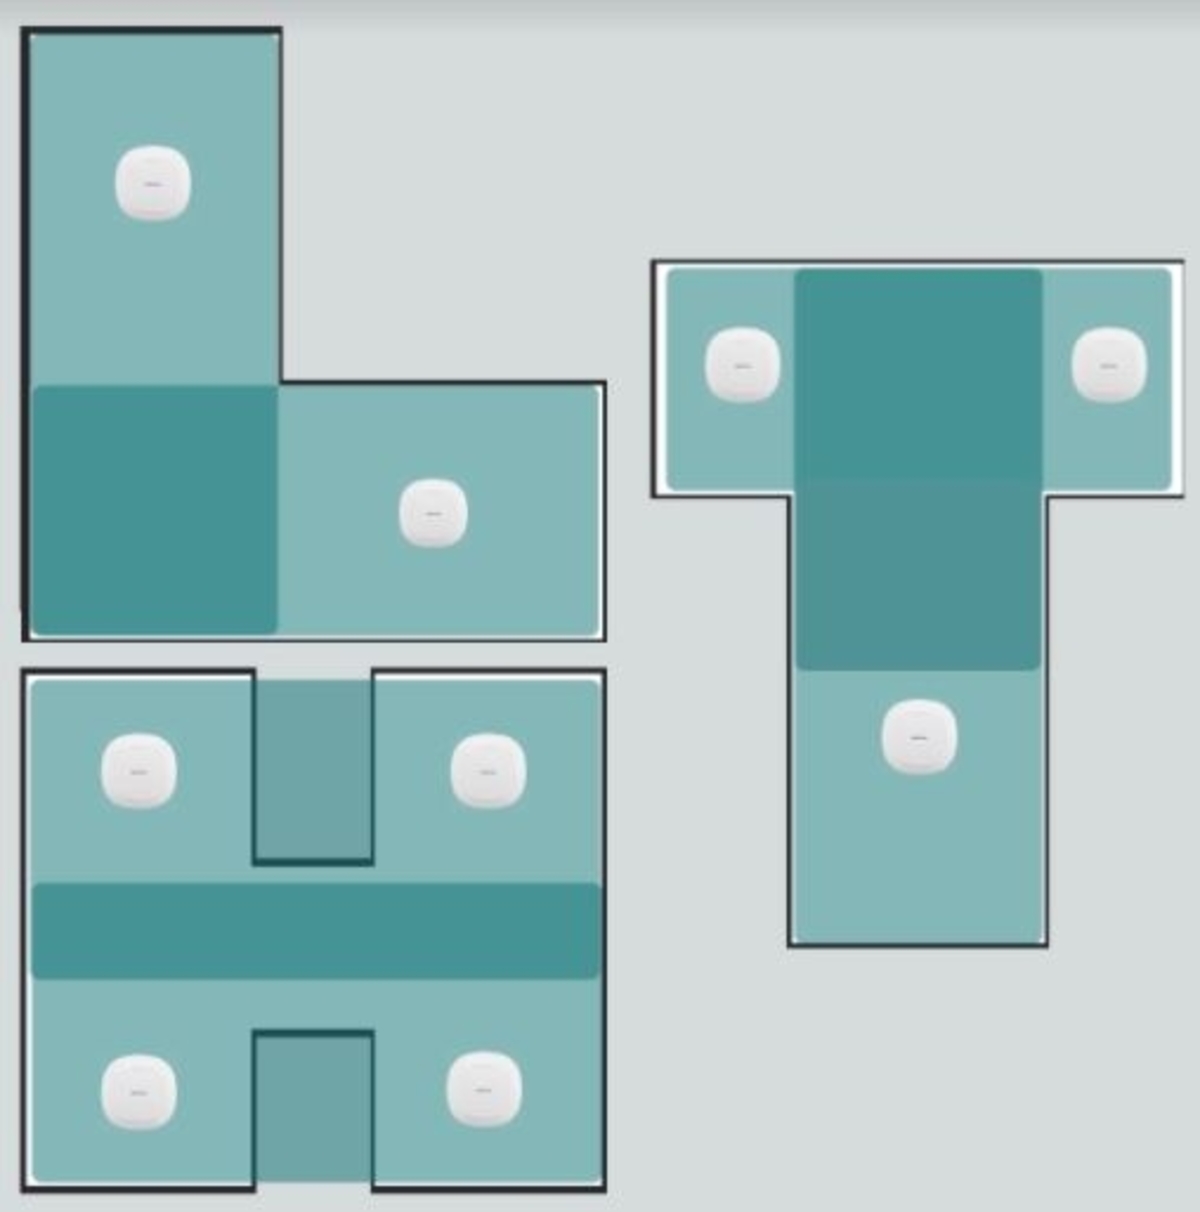
The building plan is often a factor that is taken for granted when estimating the number of devices to be purchased. Modern buildings can have different floor plans: L, H, or T.
In this scenario, the geometry of the plan itself influences coverage. In these cases, devices can not be placed in a position that will be central to all users, without the signal crossing several external or internal walls.
Follow this basic networking rules:
- L-shape – estimate more square feet than 2;
- T-shape – estimate more square feet than 3;
- H-shape – multiply the estimated square footage by 4.

Considering only the plane of the structure as the only influential architectural factor is a simplification. The presence of objects or other IoT devices can impact the propagation of the WiFi signal with the consequent loss of signal.
Furthermore, phenomena such as signal reflections, diffractions, and wave scattering have a considerable impact.
Identify the types of walls
Intuitively, concrete, brick, and reinforced concrete walls have a high magnetic permeability index. In this case, the number of devices required for efficient WiFi signal propagation is higher.
Concrete, with or without reinforcement, has a high attenuation level and represents a significant obstacle between the access point and the client device. The loss of decibels of the WiFi signal increases as the frequency increases.
In the table, below you can see the signal losses by frequency and material. The table is based on calculations and experiments carried out by the US National Institute of Standards and Technology.
| Material Attenuation | dB Loss at 2.4 GHz | dB Loss at 5 GHz | dB Loss at 6 GHz |
| Reinforced concrete (203 mm) | 31 | 55 | 63 |
| Concrete (203 mm) | 29 | 48 | 54 |
| Brick-faced concrete | 18 | 41 | 48 |
| Brick-faced masonry block | 10 | 32 | 43 |
| Concrete (102 mm) | 15 | 22 | 25 |
| Brick | 6 | 15 | 15 |
| Masonry block | 11 | 15 | 16 |
| Lumber (Dry – 38 mm)) | 3 | 4 | 4 |
| Glass (6 mm) | 1 | 1 | 1 |
| Drywall (Panel) | ~1 | ~1 | ~1 |
| Plywood (6 mm) | ~1 | ~1 | ~1 |
Decimal frequencies, wall thickness and arrangement of the material can modify these values.
For example, using the reinforced concrete (203 mm) example and imagine to have a a wall of that material between the AP and Wi-Fi clients: at 2.4 GHz, the wall attenuation with the consequent loss of signal is ~31 dB. If the AP operating frequency is changed to 5 GHz, the wall attenuation with the consequent loss of signal is going to be higher because the frequency is higher – in this case it goes to ~55 dB.
Recently, the Wi-Fi 6 and Wi-Fi 6 standard introduces the 6GhZ as commercial frequency. Considering the abovementioned example of reinforced concrete (203 mm) wall, the growing band frequencies increases the wall attenuation with the consequent loss of signal to ~63 dB.
The same concept of increasing signal loss as frequency increases also applies to other types of walls.
Estimating the number of access points, it is fundamental to consider the technical characteristics and configurations of the devices, including bandwidth, signal strength, and range. For networks that require large numbers of devices, a platform like Tanaza is essential for comprehensive remote management. The platform allows to monitor 24/7 the signal status, with the ability to modify the necessary settings for each access point in bulk.
Number of contemporary users
The number of contemporary users is a parameter for estimating access points that should only be considered in areas with a large number of users such as schools, theatres, auditoriums, hotels, universities, and sports centers.
Imagine a traditional football stadium with a capacity of 50000 people for a summer concert. The size of the rectangular area is 650 feet x 750 feet. To obtain the number of access points required, you need to calculate:
TOTAL ENVIRONMENT AREA / MAXIMUM COVERAGE AREA OF THE DEVICE
At this point, we consider the number of connected users. With the stadium at max capacity, let’s assume that only 50% of the spectators have connected to the WiFi network: 25000 spectators. Of these, 10,000 are using it together to share the most exciting moments of the event. Once you have performed the above calculation to determine the number of access points needed, you can divide the number of users / the number of APs to quantify the number of access points per device.
Calculate the Capacity/Throughput per user/application
Another method to estimate the number of access points needed is to calculate the capacity requirements. We have already talked about this topic in a previous article: click here to read.
For a quick review, consider 4 basic formulas:
- AP Throughput divided by User Throughput = Users per AP
- Users per AP divided by active users = Usable users per AP
- Usable Users per AP divided by Adoption Rate = Service Area/Cell Size
- Capacity divided by service area = AP count
Available statistics include:
- data received and sent by the network in real-time;
- the status of the access points in real-time;
- historical statistics on possible disconnections;
- RAM/CPU load percentage in real-time;
- blocked packets and error rate;
- the number of connected clients and the aggregate upload and download speed.
Use Hamina Wireless as network planner

Network planners as Hamina Wireless allows MSPs, ISPs and SPs to scientifically scan internal and external environments in order to execute real-time heatmappings.
Network administrators can easily design Wi-Fi networks with accurate 3D antenna modeling predictions and automatic, customizable and dynamic reports to check network parameters as:
– AP placement;
– First, secondary and tertiary coverage;
– SNR;
– Interferences;
– Data rate;
– AP radio details
On April 27th at 5pm CEST, Hamina Wireless will be host of a Tanaza webinar to present its revolutionary network planner. Join the webinar.


